
Why Do I Need to Know How to Spell 'Ramachandran'?
V. L. H. Bevilacqua
reviewed by:
Dr. Jennifer Powers (Kennesaw State University)
Dr. Ruth Reed (Juniata College)
Purpose: Biochemistry students often find it difficult to understand exactly what the angles f and y are, why anyone would want to plot y versus f angle pairs and what a Ramachandran plot (f/y plot) "means" in terms of understanding peptide and protein structure. This module provides graphics to aid in understanding these concepts. The module is primarily intended for use by instructors as a classroom demonstration. Thus, text is avoided except to clarify graphics. The module may also be used (along with the f/ydiscussion in a standard biochemistry text) by students as a self demonstration. Note that the answer to the title question is not given :)
Suggestions: It is recommended that the module be used along with a three dimensional model constructed using a model kit. Instructors may wish to request that students bring model kits to class for the demonstration.
Methods: The graphics in this module were created using the program CAChe. Peptide geometry was optimized with the Conjugate Gradient method under the molecular mechanics (Mechanics) application of CAChe. Single-angle conformational energy calculations were carried out using Sequential Search (.Seq) under the Mechanics application, while f/y conformational energy maps were calculated using Exhaustive Search (.Map) under the Mechanics application. Default parameters were used for the calculations.
Shortcut Cuts to Graphics:
- Peptide Analogue
- f Angle
- y Angle
- Conformational Potential Energy (P. E.) Related to f Rotation
- P. E. as a Function of f
- Minimum Energy Conformation
- Maximum P. E. Point
- Maximum Energy Conformation
- Conformational Potential Energy (P. E.) Related to y Rotation
- P. E. as a Function of y
- Minimum Energy Conformation
- First Local P. E. Maximum
- First Local Maximum Conformation
- Global Maximum
- Global Maximum Conformation
- Potential Energy Related to Both f & y Rotation & the Ramachandran Plot
- Maximum Energy Conformation
- f/y Energy Map, highest level, top view
- f/y Energy Map, highest level, side angle view
- First Local Maximum Energy Conformation
- f/y Energy Map, First Local Maximum, top view
- f/y Energy Map, First Local Maximum, side angle view
- One Other Local Maximum Conformation
- f/y Energy Map, Other Local Maximum, top view
- f/y Energy MapI Other Local Maximum, side angle view
- Global Minimum Conformation
- Global Minimum Conformation, rotated to show hydrogen-bond pair
- f/y Energy Map, lowest level, top view
- f/y Energy Map, lowest level, side angle view
1. Peptide Analogue
If you have Chime installed, click on the figure to rotate the molecule.
Go to Shortcuts to Graphics Go to 2. (next graphic)
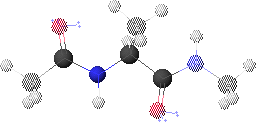
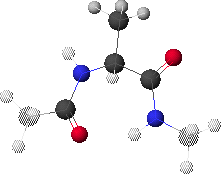
We consider here a peptide analogue which contains a single amino acid residue, alanine (Ala), flanked by two peptide bonds and capped at each end with methyl groups.
We will use the methyl group side chain of the Ala residue as our visual anchor point. Conformations will generally be oriented so that the Ala methyl group is at the top and slightly rotated forward. The Ala methyl group is attached to the Ala alpha-carbon (Ca1) at the center of the peptide.
In this view, the Ala amide nitrogen (NH1) is attached to the left of Ca1. The carbonyl carbon (CO-1) to the left of NH1 represents the C-terminal end of the preceding residue.
In this view, the Ala alpha-carbonyl carbon (CO1) is attached to the right of Ca1. The amide nitrogen (NH+1) to the right of CO1 represents the N-terminal end of the succeeding residue.
The methyl carbons at each end correspond to the alpha-carbons of the preceding and succeeding residues.
2. f Angle

2.B: f Angle Positive Rotation
Go to Shortcuts to Graphics Go to 3. (next graphic)
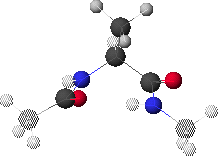
The f angle is the torsion angle specified by the spacial positions of CO-1, NH1, Ca1 and CO1. These atoms are highlighted in 2.A. CO-1 is the left-most highlighted atom and CO1 is the right-most highlighted atom.
2.B shows a view of the peptide conformation from 2.A looking along the Ca1-NH1 bond.
Ca1 is at the center. NH1 (unseen) is behind Ca1. CO1 is below Ca1. CO-1 is above Ca1. f is defined as positive for clockwise rotation of CO-1, when looking along the Ca1-NH1 bond. In this conformation, f 180
180 .
.
3. y Angle

3.B: y Angle Positive Rotation
Go to Shortcuts to Graphics Go to 4. (next graphic)
The y angle is the torsion angle specified by the spacial positions of NH1, Ca1, CO1 and NH+1. These atoms are highlighted in 3.A. NH1 is the left-most highlighted atom and NH+1 is the right-most highlighted atom.
3.B shows a view of the peptide conformation from 3.A looking along the Ca1-CO1 bond. Ca1 is at the center. CO1 (unseen) is behind Ca1. NH1 is below Ca1. NH+1 is above Ca1.
y is defined as positive for clockwise rotation of NH+1, when looking along the Ca1-CO1 bond.
In this conformation, f 180
180 .
.
4. Conformational Potential Energy (P. E.) Related to f Rotation
4.A: P. E. as a Function of f
The x-axis runs from -180 to +180
 .
.
4.B: Minimum Energy Conformation
f  -160
-160
Go to Shortcuts to Graphics Go to 4.C (next graphic)
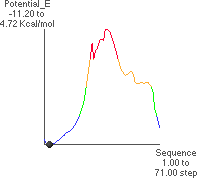
The theoretical conformational potential energy for a given conformation can be
calculated. 4.A shows the potential energy for the peptide as a function of f. Here,y
(approximately 180 ) and all the other angles besides f are kept constant.
4.B shows the extended conformation which corresponds to the energy minimum (black dot in 4.A). Here, the atoms defining f are highlighted, as well as the carbonyl oxygens and alanine methyl atoms.

4.D: Maximum Energy Conformation
Go to Shortcuts to Graphics Go to 5. (next graphic)
4.C and 4.D show the maximum potential energy point and corresponding
conformation, respectively (f  16
16 ). This conformation can be predicted as being
unfavorable by using a three-dimensional model and manually rotating about f.
5. Conformational Potential Energy Related to y Rotation
5.B: Minimum Energy Conformation
Go to Shortcuts to Graphics Go to 5.C (next graphic)
The theoretical conformational potential energy for a given conformation can be
calculated. 5.A shows the potential energy for the peptide as a function of y. Here, f
(180 ) and all the other angles besides y are kept constant. There is one global
maximum potential energy. There are two local maxima. The x-axis runs from -180
 to
+180
 .
.
5.B shows the extended conformation which corresponds to the energy minimum (black
dot in 5.A). y  176
176 . Here, the atoms defining y are highlighted, as well as the C1 oxygen and alanine methyl atoms.
5.C: First Local P. E. Maximum
5.D: First Local Maximum Conformation
Go to Shortcuts to Graphics Go to 5.E (next graphic)
5.C and 5.D show one local maximum potential energy po � int and the corresponding
conformation, respectively (y  -6
-6 ). This conformation can be predicted as being
unfavorable using a three-dimensional model and manually rotating about y.

5.F: Global Maximum Conformation
Go to Shortcuts to Graphics Go to 6. (next graphic)
5.E and 5.F show the maximum potential energy point and corresponding conformation,
respectively (y  -108
-108 ). Note that this conformation cannot easily be predicted as
being unfavorable using a three-dimensional model and manually rotating about y.
6. Potential Energy Related to Both f & y Rotation & the Ramachandran Plot
6.A: Maximum Energy Conformation

6.B: f/y Energy Map, highest level, top view
6.C: f/y Energy Map, side angle view
Go to Shortcuts to Graphics Go to 6.D (next graphic)
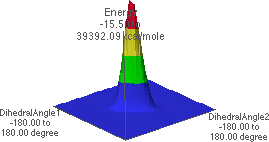
6.B shows an energy map for all possible combinations of f and y. For each f/y pair of angles, the energy is shown as a colored intensity (maximum energy is red, minimum is blue). Here "DihedralAngle1" (y-axis) is y and "DihedralAngle2" (x-axis) is f.
6.C shows the energy map looking from the f = -180 , y = -180
 corner towards the f =
180
 , y = 180
 corner.
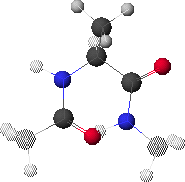
6.A shows the conformation corresponding to the maximum energy (red region in 6.B, f  0
0 , y
, y  0
0 ).
).

6.D: First Local Maximum Energy Conformation>

6.E: f/y Energy Map,
First Local Maximum, top view

6.F:f/y Energy Map,
First Local Maximum, side angle view
Go to Shortcuts to Graphics Go to 6.G (next graphic)
6.E and 6.F show a lower level in the map, revealing two local maxima energies. The
global maximum at the center has been "chopped off" at this level. The local maxima
correspond to f  0
0 , y
, y  �180
�180 , with the corresponding conformation shown in 6.D.
6.G: One Other Local Maximum Conformation
6.H: f/y Energy Map,
Other Local Maximum,
top view

6.I: f/y Energy Map,
Other Local Maximum,
side angle view
Go to Shortcuts to Graphics Go to 6.J (next graphic)
Dropping down still further in contour level (6.H & 6.I) reveals additional local maxima. The point marked by the black dot corresponds to the conformation shown in 6.G.
6.K: Global Minimum Conformation,
Conformation rotated to show hydrogen-bond pair
6.L: f/y Energy Map,
lowest level, top view

6.M: f/y Energy Map,
lowest level, side angle view
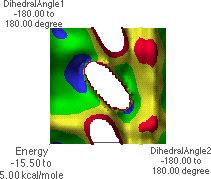
Dropping down yet once more results in the map shown in 6.L & 6.M. The global minimum point (blue region with black dot in 6.M) corresponds to the conformation shown in 6.J. Rotating the structure forward slightly reveals a possible hydrogen bond pair (6.K).
A Ramachandran plot is a plot of all of the f/y angle pairs for a given protein or a group of proteins. Standard biochemistry texts contain example plots. A Ramachandran plot does not search all possible conformations about each f/y angle. Instead, the actual data for each f/y pair is plotted. There will be as many points on the plot as there are f/y angle pairs in the protein(s). Biochemistry texts also show the "allowed" regions for f/y angle pairs. The f/y angle pairs for a protein will almost all fall within the allowed regions. This can easily be understood from 6.L. The blue and green regions in 6.L correspond to the low-energy conformations of the peptide. Note that these regions correspond to "allowed" regions in a Ramachandran plot. Students should understand that there is nothing "magic" about the placement of the allowed regions on a Ramachandran plot. Rather, peptides simply adopt structures typically having f/y angle pairs in these regions because these are the most energetically favorable conformations.
